
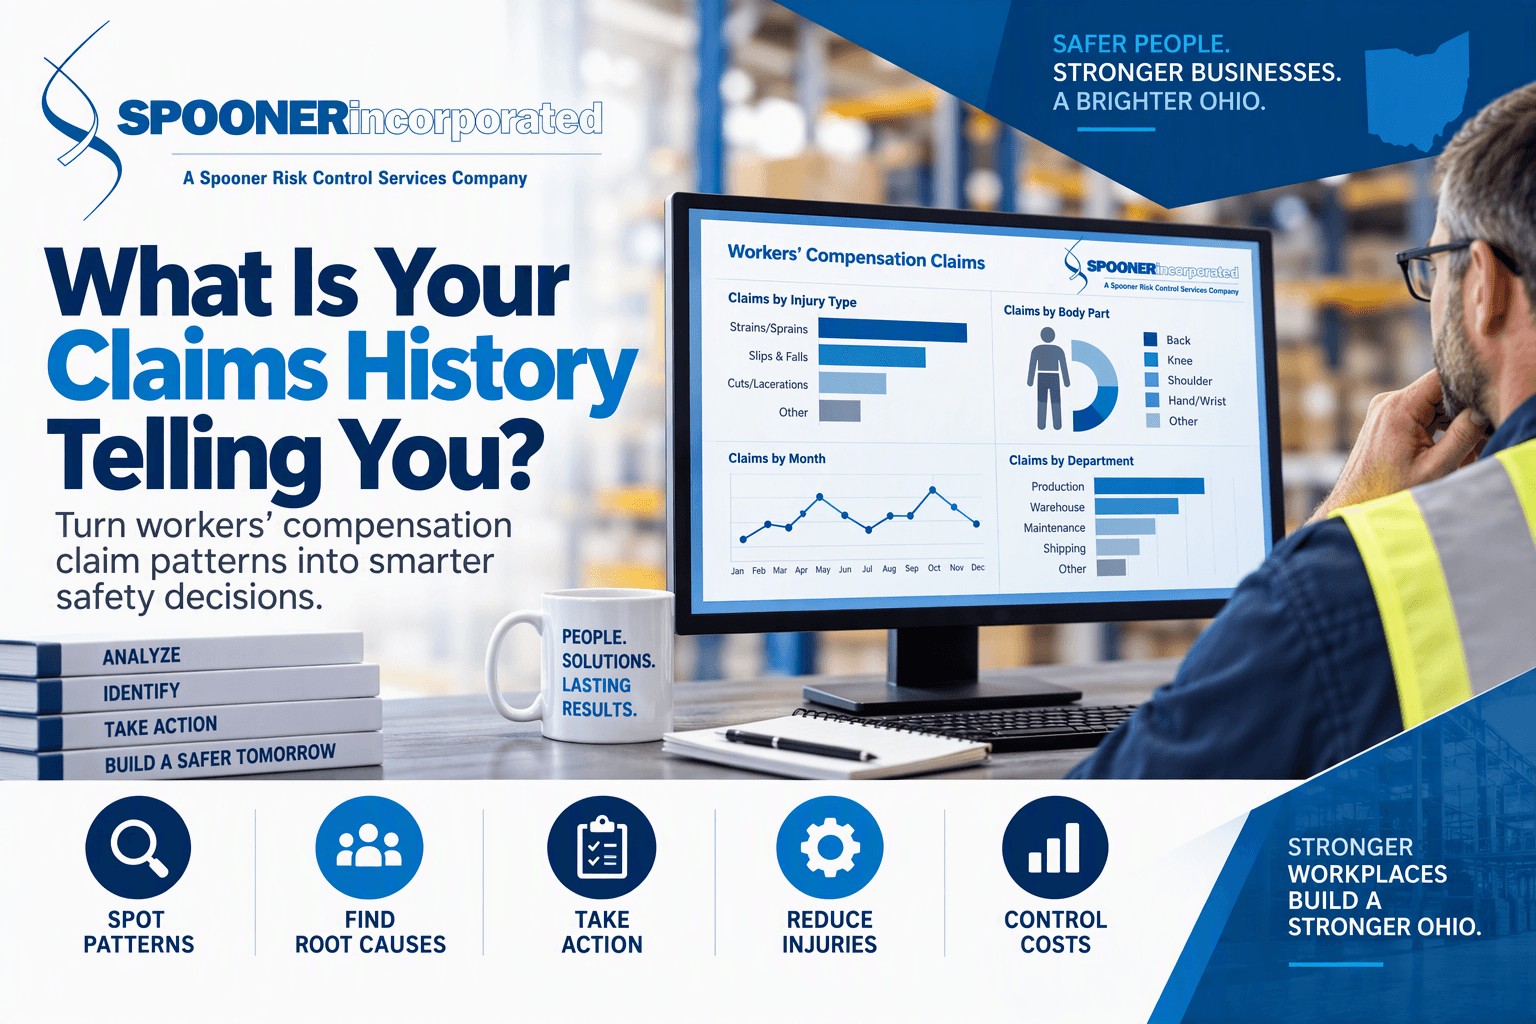
Every workers' compensation claim your business files tells a story. Taken one at a time, a claim might look like an isolated incident — a slip on a wet floor, a strain from lifting a heavy box. But when you step back and look at your claims history as a whole, patterns emerge that can point directly to the safety problems costing you the most money and posing the greatest risk to your workforce. Ohio employers who learn to read that data proactively can reduce injuries, protect their experience modifier rate (EMR), and build a safer workplace at the same time.
What Your Claims History Actually Contains
Your Ohio BWC claims data includes far more than dollar amounts. Each claim typically captures the type of injury, the body part affected, the department or job title involved, the time of day, the length of time the employee had been on the job, and whether the claim resulted in lost time. That combination of details is a diagnostic tool — if you know how to use it.
Start by requesting a loss run report from the BWC or your third-party administrator. This report summarizes your claims over a defined period, usually three to five years, and is the foundation for any meaningful analysis.
How to Spot Meaningful Patterns
Once you have your data, look for concentrations rather than individual incidents. Useful questions to ask include:
Which injury types repeat? If strains and sprains account for a disproportionate share of your claims, ergonomics and manual-handling procedures deserve attention.
Which departments or job roles appear most often? A single team generating most of your claims signals a localized problem — equipment, training, supervision, or workflow.
When do injuries happen? Claims clustered at the start of shifts may point to inadequate warm-up or task rotation. End-of-shift clusters can indicate fatigue.
How new are the injured employees? A high proportion of claims involving workers in their first 90 days on the job often reflects gaps in onboarding and safety orientation.
What is the ratio of lost-time to medical-only claims? A high lost-time rate in a specific area may mean injuries there tend to be more severe, or that return-to-work options are underused.
Turning Analysis Into Action
Data analysis only creates value when it leads to concrete changes. Once you identify a pattern, treat it the way you would any business problem: define it clearly, investigate the root cause, implement a corrective measure, and track whether the measure works.
For example, if your data shows repeated back injuries among employees in a specific warehouse zone, a site walk-through focused on that area — looking at lifting heights, floor surfaces, team lift procedures, and available equipment — is a logical next step. Pair the observation with conversations with employees who do the work daily. They often know exactly where the hazards are.
Document your corrective actions. Ohio BWC's Drug-Free Safety Program, EM Cap, and other programs like the Safety Grants may reward employers who demonstrate proactive safety management, so a paper trail of your efforts has practical value beyond compliance.
Making This a Regular Practice
Claims analysis should not be a once-a-year exercise triggered by a spike in costs. Building it into a regular safety review cycle — quarterly works well for many employers — keeps the data current and gives your team time to measure whether past interventions are actually working. Share relevant findings with supervisors and safety committees so the people closest to the work understand what the numbers show.
If reviewing your claims data feels like a project you don't have the bandwidth to take on alone, Spooner is here to help. Our team works with Ohio employers to make sense of their workers' comp history and put practical safety improvements in place. Reach out to us to start the conversation.
Find out how much you could save.
Complete our online AC-3 form for a no-cost, no-obligation review of your Ohio workers’ compensation policy.